23 03, 2021

Data entry on your PC – 23 March 2021

By |2021-03-23T21:28:47+01:00March 23rd, 2021|Feature updates|

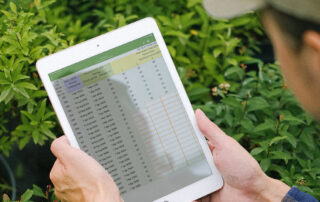
Enter data using the mobile app or PC QuickTrials has always made it easy to enter data in the field using your mobile device, but sometimes people prefer to enter trial data on a PC (Eg. to enter data in a lab or harvest weigh station).  You can enter data or make corrections to uploaded data, from your PC at any time via the web browser.  Here’s how: Step 1: [...]

19 01, 2021

The power of formulas! – 19 January 2021

By |2022-07-29T09:13:52+02:00January 19th, 2021|Preview|

  Why formulas? Formulas provide a way to transform data in real-time so users can see calculated values and normalised data immediately.  A formula can be used for simple conversions (Eg. acres to hectares or m^2), or for calculating the days to a certain growth stage from an entered date or calculating the effective, humidity adjusted and normalised (t/ha) marketable yield per plant. By using formulas to normalise data, [...]

24 11, 2020

Enhancing the mobile experience – 24 November 2020

By |2020-11-26T21:41:16+01:00November 24th, 2020|Preview|

  Enhancing the mobile experience QuickTrials is used for many different types of trials and set-ups. While this is great for trailing companies it can be a challenge from a user interface point of view, especially on small mobile screens. Sometimes field staff want to see full plot details and headers, while other times they want to focus more on comparing data values to look for anomalies. We’ve recently [...]

23 10, 2020

A single source of truth – 23 October 2020

By |2020-10-26T18:19:15+01:00October 23rd, 2020|Feature updates|

A single source of truth One of QuickTrials key benefits is its ability to organise lots of data and provide a single source of qualified information that can be referenced whenever needed.  The structured data and integration possibilities provided by QuickTrials also help to ensure longevity of your trial assets.  Our approach to digitising trials means your data will continue to grow in usefulness and value over time, as future [...]

10 08, 2020

A new List View – 10 August 2020

By |2020-08-10T13:37:01+02:00August 10th, 2020|Feature updates|

  A new List View With QuickTrails we want you to have the most effective and comfortable way of not only entering data but also reviewing it. The recently added grid view provides a great overview of the data and helps users to see the context of information in a two dimensional table like an Excel sheet. When working on devices with a small screen (Eg. a phone rather than [...]

15 06, 2020

Design preview and plot naming – 15 June 2020

By |2020-06-15T14:09:05+02:00June 15th, 2020|Feature updates|

Experimental Design Preview When setting up an experimental design, there are often many parameters involved to define the actual block and plot layout. To make this faster and more intuitive, we added a live preview of the layout at the bottom of the page. This preview allows you to play with the parameters and see exactly what will happen to the layout.  It visually shows what you can expect as [...]

9 06, 2020

Optimizing Trial Setup – 09 June 2020

By |2020-06-09T14:10:12+02:00June 9th, 2020|Feature updates|

Trials are not only executed, but also have to be set up and configured. At QuickTrials, we try to optimize every step in that process, based on customer feedback. In this newsletter, we will focus on some recent additions that will help you raise efficiency to new levels. Groupless staff permissions One of the tasks when planning the execution of field trials is the assignment of staff, to define who [...]

16 04, 2020

Enterprise perspective – April 16, 2020

By |2020-04-16T08:28:50+02:00April 16th, 2020|Feature updates|

Enterprise customers often need to compare trials across different geographic regions or examine specific traits across similar trials.  This can be a tricky data organisation challenge and our recent enhancements help to streamline and solve this problem.   Powerful Observation Library QuickTrials has a central library of traits to make it easier to compare traits across different trials or years.  Our best-practice recommendation is to use this trait library as [...]

1 04, 2020

Spreadsheet style data entry and site visits! – April 01, 2020

By |2020-04-01T15:02:29+02:00April 1st, 2020|Feature updates|

Many of you love the card layouts we have for entering data, but we also received a lot of feedback asking for an interface that resembled an Excel spreadsheet in order to better see an overview of all the data.  We took this a step further and are happy to introduce a new user interface that will make it even easier to work with your data. We now have two [...]

17 12, 2019

Arrange your plots however you like – December 05, 2019

By |2019-12-17T16:21:58+01:00December 17th, 2019|Feature updates|

More plot layout options! We had good feedback about plot layouts and are happy to announce some new features that will help with better automated layouts as well as manual arrangements     Nested latin square layout support Having a lating square inside a latin square is a powerful way to get well balanced trial results. This is now possible for trials with multiple factors Improved split plot layout The [...]

Go to Top