QuickTrials continues to be enhanced based on the feedback and requests we’ve received from our growing users. This newsletter covers some of the new features that we recently added. Our goal is to create your favourite tool for conducting agricultural field trials, where your data is always consistent and easy to analyse.
ANOVA analisys

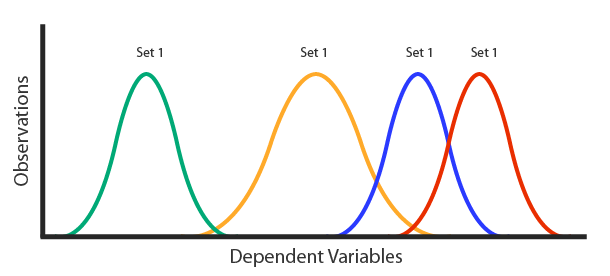
ANOVA is the most common statistical analysis, applicable on any quantitative observation made. The analysis takes into account replications and provides a coefficient of variation (CV) which shows the quality of the measurements. Based on this and the amount of variation between test subjects, we can determine if there is a meaningful difference measured.
In a second step, in case there are multiple sites, we take into account the sites and see what differences are corresponding to site or test subjects.
This new analysis feature directly gives you results with minimal effort. They can also be exported and reused.
Since we are continually enhancing analysis capabilities in QuickTrials we are always interested in hearing feedback on the kind of analysis you would most like to see.
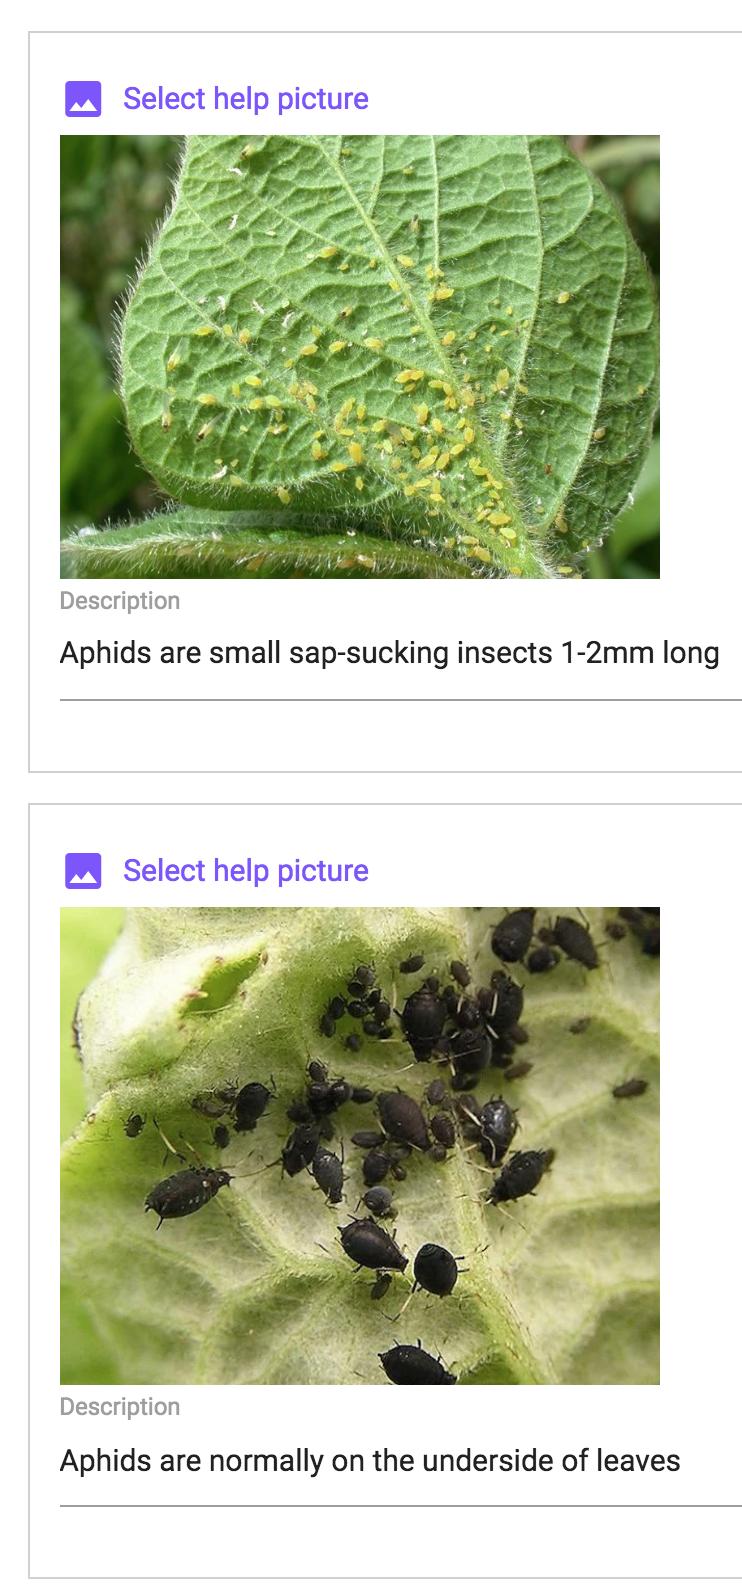
 Observations can have multiple pictures and descriptions
Its now possible to include multiple pictures and captions as part of the help text for an observation definition. This means that visual explanations can be included to assist field staff in what to look for and conduct measurements more consistently. By having all the help text and pictures available in QuickTrials there is no need to carry a separate trial procedure manual into the field!
Tables for Dataset
An observation group can be used in multiple ways in trials. Most uses concern measuring data to be analysed statistically later. But there is also good use in managing trial operations with recording the kind of fertilisers and chemicals that were used or making note of the conditions that existed during planting.
To allow a clear separation between scientific observations and management observations, we can now mark some groups as “management” and they will appear in a different section in the dashboard, in tabular form.
Excel data collection
 The compact Excel export now shows a tab with all observations collected for plots, merged from all observation groups. This means that for some kind of analysis its much simpler to access the data in a single large table, even with having the data collected via multiple observation groups.
This is particularly interesting to have good structuring for data collection in the field while not complicating things at analysis time.
We support exporting the variety list which makes it easier to manage master data sets and use the information in other systems whenever needed.


