

More new features!
Below are some of the requested features that have been recently added.
Anonymization
Trial step 2 Test subject -> Anonymization
Sometimes its necessary to anonymize data to ensure biases are not introduced when collecting measurements. We now support 3 ways of controlling how data can be annoymised for field staff.
-
Show to mobile user: The name will be directly shown. This is fine for things like sites, repetition, growth stages, but should probably not be used for your primary test subject like variety
-
Use anonymized code: The attribute called “Code” that was globally stored with the test subject will be shown instead of the name. The code can be anything, like “TOM-13” or “V34”. Every time this record will be used in this mode, the same code will be used.
-
Fully Anonymize: it is shown but in an anonymized way on the mobile. To still know the mapping of test subject to plot, one can look on the layout section of the web application or use the “Print Plots” feature.
 Images for Measurement Types
Measurement Types -> Choice -> Add image
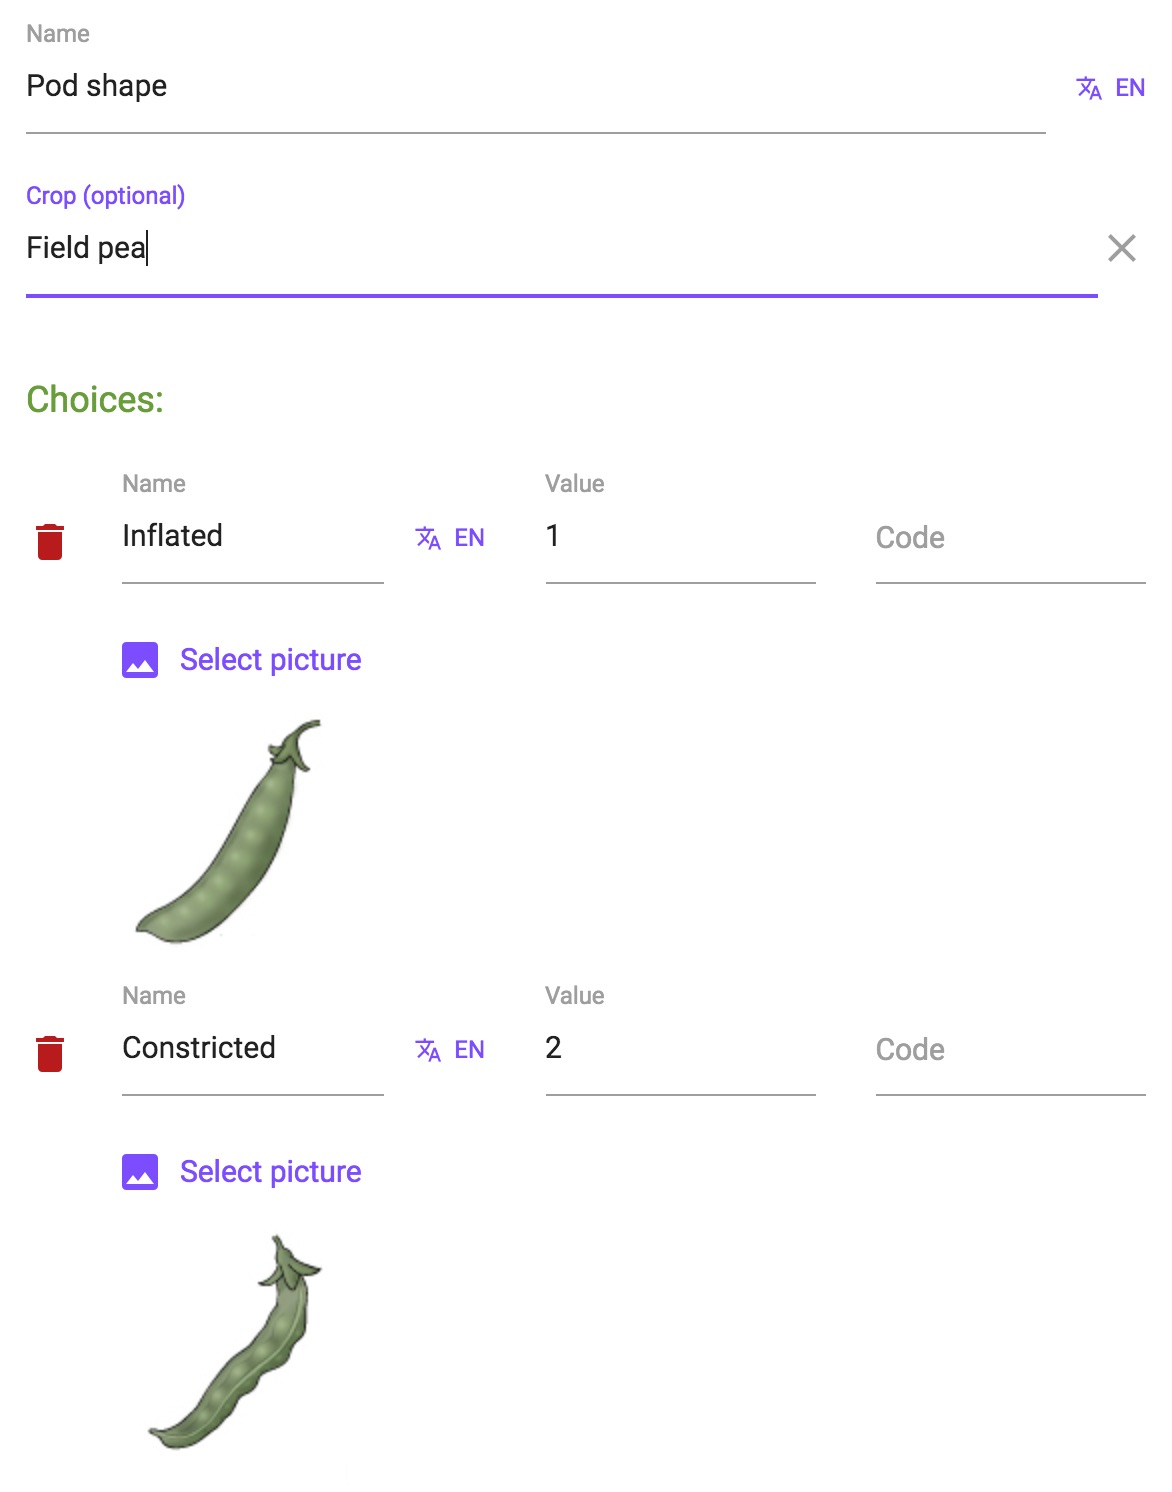 Images for Measurement Types
Having predefined lists of choices for measurements is very convenient. To ensure a common understanding each measurement can now have an image that is shown which instructs the field staff on how to perform the measurement. The image or photo can provide a reference point which is especially helpful for subjective measurements.
Better Permission Management
Groups
Data entry permissions for a group can now be added for a whole trial, so not all datasets have to be marked separately anymore.
Test Subject Management
Trial step 2 Test subject -> Control / Disabled
A test subject can now be marked as a control. This makes several statistical evaluations possible and allows referencing in the exported data. It can also be marked as disabled while the trial is running, which allows removal of test subjects if they are no longer worth measuring.
Graphs and Statistics
Trials -> Trial: Collected Measurements -> Add Charts
To make analysis easier we have been adding more graphing capabilities directly to the web application. The following chart types are now available directly without needing to use external reporting tools:
- Grouped barcharts
- Radar charts
- Normalized yield

Excel Import
 To be able to import existing data manually into the system without going over the mobile client, we allow to fill in data into an existing template in Excel.
Date measurements
Trial step 6 Observations -> Measurement -> Type: Date
Dates can now be directly selected as a measurement type. No need to create a special date dimension anymore. Just select type “Date” and you will be able to enter a date when filling in the measurement card
Dimension measurements
Trial step 6 Observations -> Measurement -> Type: Select Record
Any element of a dimension list (Eg. varieties, sites, disease etc) can now be used as a list to select from when measuring. While this will look exactly the same as a Measurement Type list for data input staff, there will be no numeric value or code available for later statistical analysis, just the selected item.
Square meters per plot
Trial step 1 Basic Information -> Area per plot (m2)
To allow dimensioning of trials that don’t have fixed numbers of plants in rows, we now also allow directly specifying the surface of a plot. This works well with sowing for example.


